Stop building dashboards.Start making decisions.

Vibe analytics, without the vibes. The agentic alternative to Power BI and Tableau: every answer traced to its SQL, on one certified semantic model, in your own cloud.

A sample session. A finance lead asks why gross margin slipped in Q3. Vine asks which margin definition to use, reconciles three sources and builds a dashboard: gross margin fell 1.8 points to 38.4%, and freight is the largest driver.

1

Anyone asks

A finance lead types a question. No ticket, no BI queue.

2

Vine does the analyst work

On governed data and certified metrics, with every step shown.

3

The answer becomes a dashboard

Saved, shared and refreshed, like the ones you build today.

Trusted by

  • Fermented Food Holdings
  • Avis Budget Group
  • Mars
  • 7-Eleven
  • Walmex
  • Walmart.com
  • AB InBev
  • McKesson
  • CBRE
  • Aon
  • Pão de Açúcar
  • Pinheiro Neto Advogados
  • Upstream
  • Revenue Management Labs
  • enjoei
  • Instituto Sonho Grande
  • Swap

Work is going conversational.Analytics is next.

WorkA year agobecomesToday
SoftwareEngineers write every lineEngineers direct coding agents
DesignScreens built by handDescribe, generate, iterate
PresentationsSlides built one by oneGenerate a deck, then refine
Customer supportAgents search and draftAI answers and takes action
AnalyticsWeeks in Power BI, built by specialistsUnchanged.(mostly)Just ask Vine.

The bottleneck isn’t the tool.It’s who can use it.

Everyone waits on BI.

Power BI today
  • CFOMargin by region?
  • SalesPromo lift by retailer?
  • PlantLine downtime by shift?
  • BrandShare trend vs category?
  • SupplyFill rate by DC?
  • HROvertime by plant?
BI developerOverloaded
WeeksThe bigger questions wait in line.

Everyone just asks.

With Vine
  • CFOMargin by region?Answered2 min
  • SalesPromo lift by retailer?Answered3 min
  • PlantLine downtime by shift?Answered2 min
  • BrandShare trend vs category?Answered4 min
  • SupplyFill rate by DC?Answered3 min
  • HROvertime by plant?Answered2 min
MinutesThe BI team moves to the bigger questions: control towers, process, architecture.

Beyond visualization.Full-stack data & analytics.

Connect.

Your sources, in your cloud, through 750+ pre-built connectors.

Connectors include Snowflake, BigQuery, Databricks, PostgreSQL, MySQL, SAP, HubSpot, Stripe, Shopify, Google Sheets, Google Analytics, Zendesk, Jira, MongoDB, Google Cloud, QuickBooks, Xero, Airtable, Notion, Kafka, Looker, Mailchimp, Google Ads, Dropbox, Box, Zoho, Odoo, ClickHouse, Elasticsearch, Supabase, MariaDB, Teradata, Mixpanel, Intercom, Asana, Google Drive, ADP, Gusto, BigCommerce, WooCommerce, Square, PayPal.

Model.

Certified metrics, defined once and agreed with the business.

Semantic
model
Certified definition
revenue= (invoiced_qty × unit_price − refunds) × fx_rateAgreed with Finance · used by every agent

Verify.

Every number traces back to the query that produced it.

Net revenueweekly · last 12 · sample
W28W33W39
Net revenue · W33$3.5MAgreed to source
query.sqlresult
SELECT DATE_TRUNC('week', invoiced_at) AS week,       SUM(net_amount * fx_rate) AS net_revenueFROM   finance.invoicesWHERE  status = 'INVOICED'  AND  invoiced_at >= CURRENT_DATE - INTERVAL '12 weeks'GROUP BY weekORDER BY week;
Every team’s questions.Answered in minutes.

A prototype is easy.A platform is hard.

A prototype

Claude
Dashboards
plus

Trust

  • Data privacy
  • Governance & IAM
  • Refresh & validation

One truth

  • One semantic model
  • Managed connectors
  • Context management

Scale

  • Usage & cost controls
  • Sharing & collaboration
  • Design consistency

= Our platform · a harness for analytics, in your cloud

We did the hard partso you don’t have to.

Sources
  • ERP / Financebatch · CDC
  • BI toolsdatasets · REST
  • CRM & opsREST · exports
  • Files & providersSFTP · S3 drops

Your cloud account · AWS / Azure / GCP / OCI · private VPC · SSO-gated

Ingestion
  • Workflow engineorchestrationschedules · retriesbackfills · signals
  • Worker pooltask queueextract & load
Storage
  • Data lakeraw landing zoneParquet · immutable
  • Data warehousecloud-native OLAPcolumnar · MPPsub-second scans
  • App databaseapp state · authzmetadata
Transform
  • Transformationstaging → martstests · lineagedocs · CI checks
  • Semantic layermetric definitionsentities · grain
AI agent
  • Event busstreams · pub/subagent steps → UI
  • Agent runtimeplanningtool callsguardrails
  • LLM gatewayprompt logredaction
Application
  • API serverREST · SSERBAC · audit log
  • Web appcharting librarydashboard grid
  • Deliverydashboards · chatscheduled reports
PlatformIaC · CI/CD · SSO · secrets vault · observability

LLM endpoint · cloud-managed

Through your cloud provider’s model service

private endpoint · no training · no retention

The workflow engine schedules ingestion from your sources and dispatches tasks to a worker pool; both land raw data in the data lake as Parquet, which is bulk-loaded into the warehouse. Transformation builds tested models and marts in the warehouse, and the semantic layer compiles certified metrics to SQL against it. The agent runtime takes the results, calls the model through an LLM gateway (tokens out to and back from your cloud's LLM endpoint), and streams its steps over an event bus to the API server, which also asks it questions. The API serves the web app and scheduled delivery, and keeps app state, access, audit and schedules in the app database.

No need to start over.Bring your assets with you.

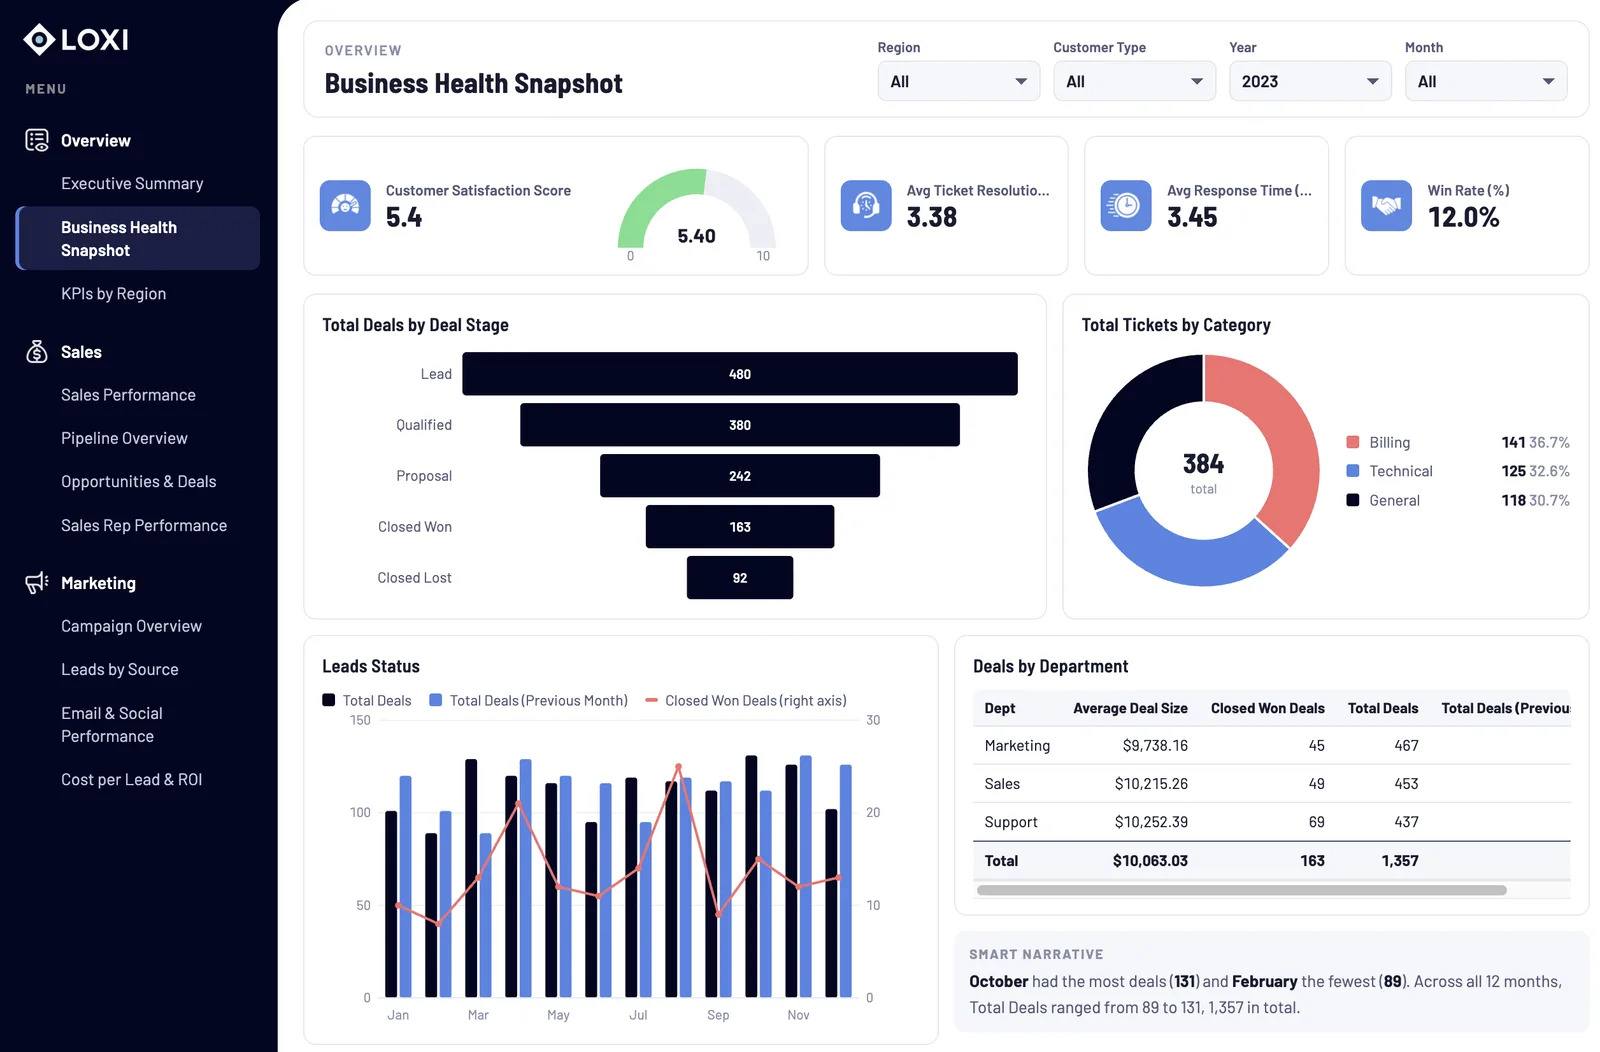
Example file
A Power BI report, Business Health Snapshot, with five regions numbered
Business Health Snapshot.pbip · report.json
  1. Formatting"fill": { "solid": { "color": "#6FDF8C" } } }
  2. Calculated field (DAX)measure 'Avg Ticket Resolution Time' =AVERAGEX(SupportTickets, DATEDIFF(…, DAY))
  3. Chart type"visualType": "funnel","projections": { "Category": ["Deals.DealStage"] }
  4. Data source (Power Query)File.Contents("CRM_Dashboard.xlsx")Source{[Item="SupportTickets"]}[Data]
  5. Size & position"x": 203.6, "y": 410.0, "z": 23000"width": 531.8, "height": 280.0

Vine reads the code and definitions inside your Power BI and Tableau files, so nothing is rebuilt by hand.

  • Jaques Castello, co-founder and ceo of Vine Analytics

    Jaques Castello

    Co-founder · CEO

    Fortune 500 BI leader

    • 12 years in CPG: Global Head of Analytics, US Pricing at Kraft Heinz
    • Led an 80+ FTE team and an 8,000-asset migration from Tableau to Power BI
    • Ex-McKinsey, AT Kearney
    • Mechanical-Aeronautical Engineer, ITA
    • Math and Astronomy National Medalist
    • McKinsey & Company
    • Kraft Heinz
    • ITA
    • AT Kearney
  • JP Steiner, co-founder and cfo of Vine Analytics

    JP Steiner

    Co-founder · CFO

    World-class B2B connector

    • 8 years in CPG: Strategy & eCommerce at Kraft Heinz
    • Strategy Controller, Northern Europe; led the U.S. eCommerce Path to Purchase integration
    • Ex-Falconi
    • Industrial Engineer, Northwestern
    • Division 1 student-athlete, swimming
    • Kraft Heinz
    • Northwestern University
    • Falconi
  • Michel Sena, co-founder and cto of Vine Analytics

    Michel Sena

    Co-founder · CTO

    10x full-stack engineer

    • 7 years in software engineering: React, Next.js, Node.js, Python, Django, PostgreSQL, dbt, LangChain
    • Ships on AWS, Azure, GCP and OCI with Terraform
    • Serial founder & CTO: Teora, Guilda, Upvote
    • Electronic Engineer, ITA ’20
    • 1st place in AFA admission; #1 student at Poliedro
    • ITA
    • Teora
    • Upvote

See it on your own data.

“This is a great example of what becomes possible when AI begins with a real business need, not with the technology itself.”
CIO

Questions?
Good.

Anything else, write to admin@upvote.app.

What is Vine Analytics?

Vine Analytics is an agentic business intelligence (BI) platform from Upvote Technologies. AI agents connect to a company’s data, build dashboards, investigate performance and answer business questions in plain language, in minutes. Every answer is governed by one semantic model and traceable to the SQL behind it.

What is agentic analytics?

Agentic analytics is business intelligence where AI agents do the analytics work: writing the SQL, building the dashboard and investigating the variance. People ask the questions and make the decisions. In Vine Analytics, every agent answer is traceable to the query that produced it.

Who makes Vine Analytics?

Vine Analytics is built by Upvote Technologies. It was co-founded by Jaques Castello (CEO), former Global Head of Analytics for US Pricing at Kraft Heinz; JP Steiner (CFO); and Michel Sena (CTO), a serial founder and software engineer.

Is Vine Analytics an alternative to Power BI or Tableau?

Yes. Vine Analytics is an agentic alternative to Power BI and Tableau, and companies don’t need to start over. Power BI files are JSON and Tableau files are XML under the hood: Vine reads them, rebuilds the dashboards against one semantic model and validates them to cell-level parity.

Does Vine Analytics send company data to an LLM provider?

No. Vine Analytics runs in the customer’s own cloud account, in a private VPC behind SSO. AI models are called through the cloud provider’s private endpoint, with no training on customer data and no retention.

Which clouds and data sources does Vine Analytics support?

Vine Analytics deploys in the customer’s own AWS, Microsoft Azure, Google Cloud or Oracle Cloud (OCI) account. It connects to ERPs, CRMs, billing systems, data warehouses and spreadsheets through 750+ pre-built connectors.

How does Vine Analytics make sure AI answers are accurate?

Vine Analytics answers every question from the Vine Semantic Model, which holds one certified definition per metric, agreed with the business. Every chart shows the SQL query behind it, so finance and data teams can verify any number.

How is Vine Analytics different from using Claude or ChatGPT on company data?

Claude or ChatGPT build one answer at a time for one person. Vine Analytics puts Claude inside a governed platform (privacy, IAM, one semantic model, managed connectors, refresh and lineage), so every team gets answers the company can stand behind.

What does a Vine Analytics pilot involve?

A Vine Analytics pilot is a scoped engagement on the customer’s own data, deployed in the customer’s cloud. The Vine team starts from the dashboards the company already relies on and does the build alongside its BI team.

What happens to the BI team when a company adopts Vine Analytics?

With Vine Analytics, the BI team stops working through a queue of routine requests and moves to higher-value work: control towers, process and architecture.